tm1login cube

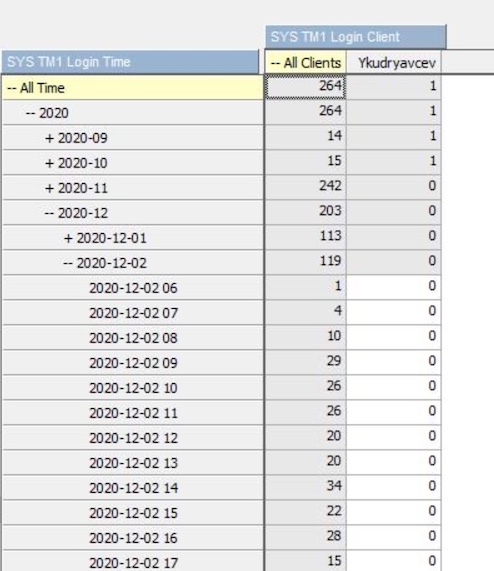
And in case you’re using the tm1logins log file as per the previous post, here’s a TI that builds a very simple analysis cube that shows you the user logins per hour. Add it to your server and schedule a chore to update it, it should take seconds to run on a 10mb logins file. I’m using it for very simple activity analysis, answering the ‘who is using the system at all’ and ‘what is the login distribution within the day’ to identify when you can do maintenance.
 I found writing this TI an interesting exercise, might use it as interview ‘how would you’ type of question if I get a chance. It actually is both very simple and has a number of dimensions to it as this post illustrates.
So let’s play this out, I’ll explain my reasoning behind how my version works and where you could deviate.
How can we check who logged on a given day
One way is to use the ClientPropertiesSyncInterval parameter and read transaction log filtering against the }ClientProperties cube as per this TM1Forum thread.
I much prefer using the tm1s-log.properties configuration as you don’t need a save data to unlock a transaction and don’t need to read all the transactions (there can be heaps) and you get a simple & small tm1logins file that looks like this:
23792   []   DEBUG   2020-10-11 18:28:47.234   TM1.Login   Login Success: User Jane
21084   []   DEBUG   2020-12-11 13:28:47.256   TM1.Login   Login Success: User John
Let’s say we use a logins file, let’s model an ‘analysis’ cube
We need a Clients dimension – I try no to touch control dimensions when possible (yay unexpected locks otherwise), so I’m creating my own one based on the file.
We need to record date & time, so it’s the usual mutliple dimensions vs one to model time conversation can ensue. I’m firmly a one continiuos dimension guy now due to performance and ease of use, so one dimension it is. We also need to define granularity of recording data – the file is down to milliseconds.
I’m doing it to an hourly level as I deem anything more detailed misleading as RestAPI connections (Cognos Analytics and PaW) run a login session for every object on screen independently, so you get Jo logging in 10 times within 30 ms.
Do we need a measure dimension? What should go there?
I don’t add one as I don’t understand what measures should be there that wouldn’t be misleading.
So how do we read a logins file
It’s a typical ‘how to read incremental data’ type of questions.
Since each login is appended to the file and the file is rotated on a schedule, if you want to really count the logins by hour, you’d need to be really careful about how to clear out data. The usual approach is to have a separate TI to read the file and find the ‘when the file starts date’ and clear cube cells onward, so a simple tasks becomes a couple of TIs, with parameters passed from one to another and etc.
At the same time, I don’t need the exact number of logins, I just want to know if user logged in or not, so I’m using CellPutNs and not clearing data at all – very simple and crude approach that I kinda like for the task at hand.
Adding calculations and Anything else
It’s actually one of the few times I found ConsolidatedCountUnique usefull. And you can go nuts with averages here, but I’m hard pressed to think about anything that adds value to what it does already.
You can go full on with hierarchies on time dimension (hourly distribution by month lead us to determine that our users are more active in early hours in spring!), maybe add a few measures to compute average activity metrics, try to capture the individual login sessions.
I’m in ‘don’t add anything you can live without’ camp lately – so you have none of that in the TI above :)