Cognos BI 10.2.1 3 charting engines: The Good, The Bad and The Ugly
Feature updates went largely unnoticed with BI 10.2.1 FP1 release. It’s highly unusual to have major feature updates in fix packs, they’re usually held up to releases. But in this case we’ve got Rapid Analytical Visualisation Engine (RAVE) available in all reports, not only Active Reports (as per core 10.2.1). And that’s big news worth spreading!
So now you have 3 different charting engines 10.2.1 BI:
- the “old” / legacy Cognos 8 charting
- the ”new” Cognos 10 charts
- RAVE visualisations
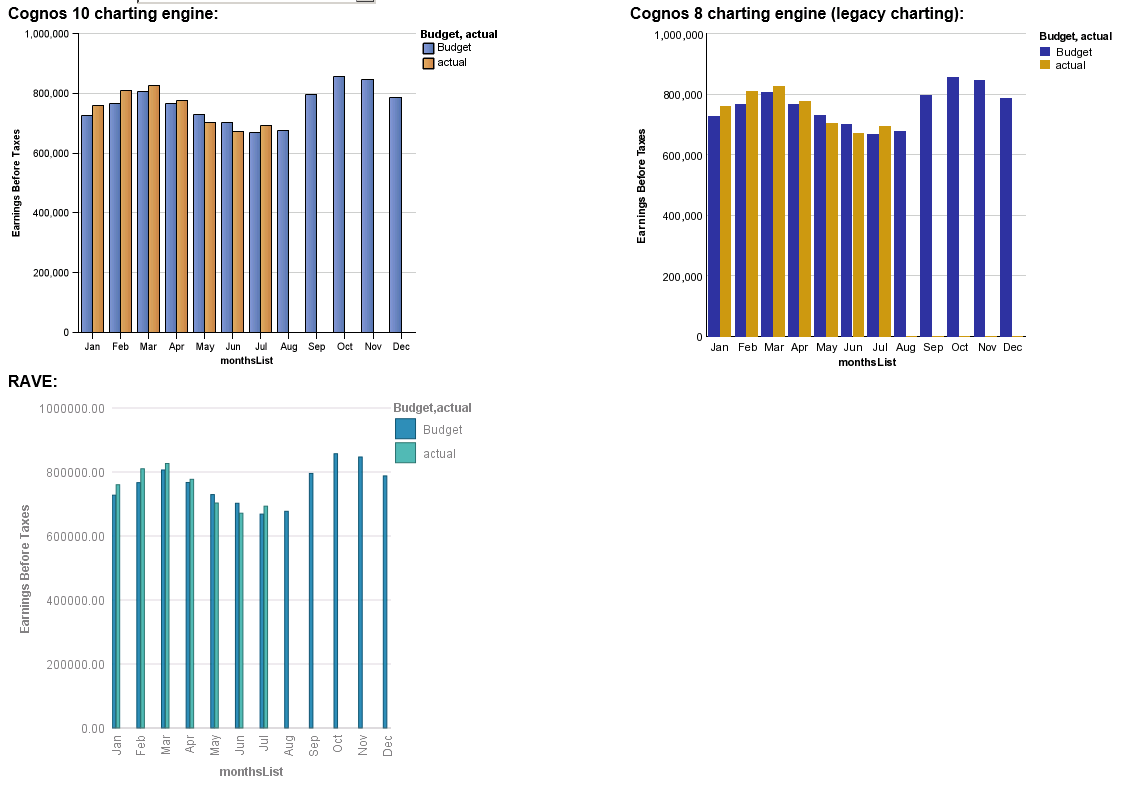
I couldn’t resist and dropped them together in one report:
It’s now a good time to say that film title reference in post name is completely accidental, as non-native speaker I just can’t walk away from obvious word play.
But jokes aside, which one do you like best? I intentionally used default settings in all charts (didn’t have much choice with RAVE, though).
- In my opinion, 8 charts win by all rules, palette is easily distinguishable, chart looks clean and simple.
- Palette in Cognos 10 charts is really misleading, blue bars on the left seem darker than on the right because they “blend” in with orange. It looks like there’s more than 2 colours in the bars. I understand the idea of trying to make palette softer, but it looks bad anyway. And box borders don’t help either.
- RAVE — please just shoot me, it’s joke )
It’s all customisable, but defaults got way worse along the way, imho.
More about RAVE
RAVE is the graphical engine that powers ManyEyes, an online visualisation engine launched in about 2008. Back then visualisation + web 2.0 collaboration sounded like future, so there were a few projects that were aimed on providing online collaborative data exploration tools (anyone remembers Swivel?). As it turns out, most of the people just wanted a place to quickly build basic visualisations to embed in their posts/news and didn’t care so much about others (surprise), which lead to eventual demise of most such projects.
Here’s a wonderful post about ManyEyes IBM story, read it, it’s really worth it. I especially like this quote:
Looking back, the hardest and most frustrating part of this development exercise turned out to convince IBM legal to approve a public (!) website where people could upload any data they want (!) for anybody else to see (!).
ManyEyes eventually got stacked into IBM’s Business Analytic division and shelved somewhere, up until competition from “visualisation” vendors such as Tableau and Qlickview forced IBM to find some suitable answers. We’ve got Cognos Insight’s viz capabilities at first and then somebody just realised that they already had a viable viz engine just around the corner, so rendering engine from ManyEyes got dusted and repacked into Cognos stack. And that’s wonderful, because it’s easily extendable and customisable, so creating new visualisation types should be heaps easier than adding them to “core” charting engine. And it’s obviously scalable ;)
Right now, though, RAVE customisations are severely limited, you can’t change a chart’s palette, label colour, anything, even your initial chart type options are quite limited, there are no combination charts / dual axises. Check the list of available visualisations at AnalyticsZone.
All changes / additional viz requirements have to go through Business Analytics support. But there’ll eventually be some tooling to enable RAVE customisations. I would also speculate that there’s a huge number of visualisation types that are not generally available for Cognos yet and will surely come out eventually.
Update: The Visualisation customisation tool is now available here